Maps That Tell Stories, Reveal Patterns, Guide Decisions
Where Art Meets Accuracy: Maps That Tell Stories, Guide Decisions, and Reveal Hidden Patterns


Our Mapping Philosophy
"A map is the greatest of all epic poems. Its lines and colors reveal the story of a place, its people, and its possibilities."
— Adapted from Bradbury
At VTA Namibia, we believe every map should tell a story. Whether it's guiding tourists through the Namib Desert or helping urban planners visualize growth patterns, our maps combine scientific precision with artistic vision.
Our Maps
Four pillars of our cartographic excellence

Spatial Storytelling
We don't just draw maps, we tell stories through them. Our maps reveal hidden patterns and narratives invisible to standard cartography.

Multi-Layer Intelligence
Working with our GIS and software teams, we embed spatial intelligence, real-time data, and predictive analytics into every map.
AR-Enhanced Cartography
Namibia's only maps that come alive. Scan with any smartphone to access video, 3D models, and interactive content.

Survey-Grade Precision
Sub-meter accuracy using professional GPS and Namibia-specific datum (Schwarzeck). Maps you can build on—literally.
Mapping That Makes a Difference
Real impact from real projects

Health Facility Atlas
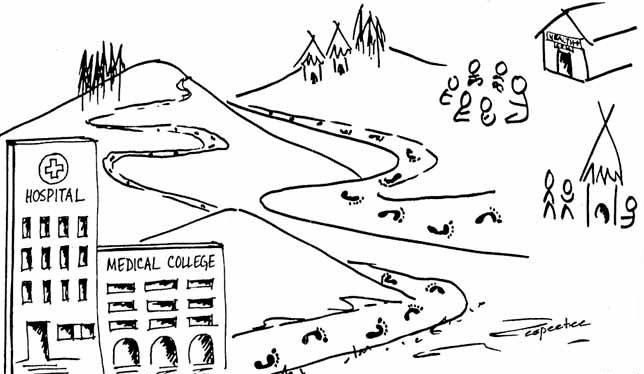
127 facilities mapped across Kavango East, revealing that 40% of disease outbreaks occurred within 5km of water points—a pattern invisible to standard maps.

Flood Risk Mapping
Predictive flood zones for the Zambezi region with 85% accuracy, providing 72-hour advance warnings to vulnerable communities.

Informal Settlement Mapping
15,000+ structures mapped in Windhoek using drone imagery and AI, enabling service delivery to 50,000+ residents.

Tourism Story Maps
AR-enhanced visitor maps that increased time spent at sites by 40% and drove 25% more bookings for partner lodges.
The Power of Great Maps
According to the Namibia Statistics Agency, fragmented spatial data severely hinders decision-making across critical sectors. Most organizations collect location data but never visualize it, leaving patterns invisible, relationships undiscovered and opportunities untapped.
The hidden opportunity: Our maps reveal patterns invisible to standard analysis.
VTA Namibia combines survey-grade precision with artistic design to create maps that don't just show locations but tell stories, guide decisions and reveal the hidden geography of your data.

Sub-meter accuracy

AR-enhanced

Pattern discovery

Storytelling
Our Mapping Services
Each service combines spatial precision, technical excellence and creative design
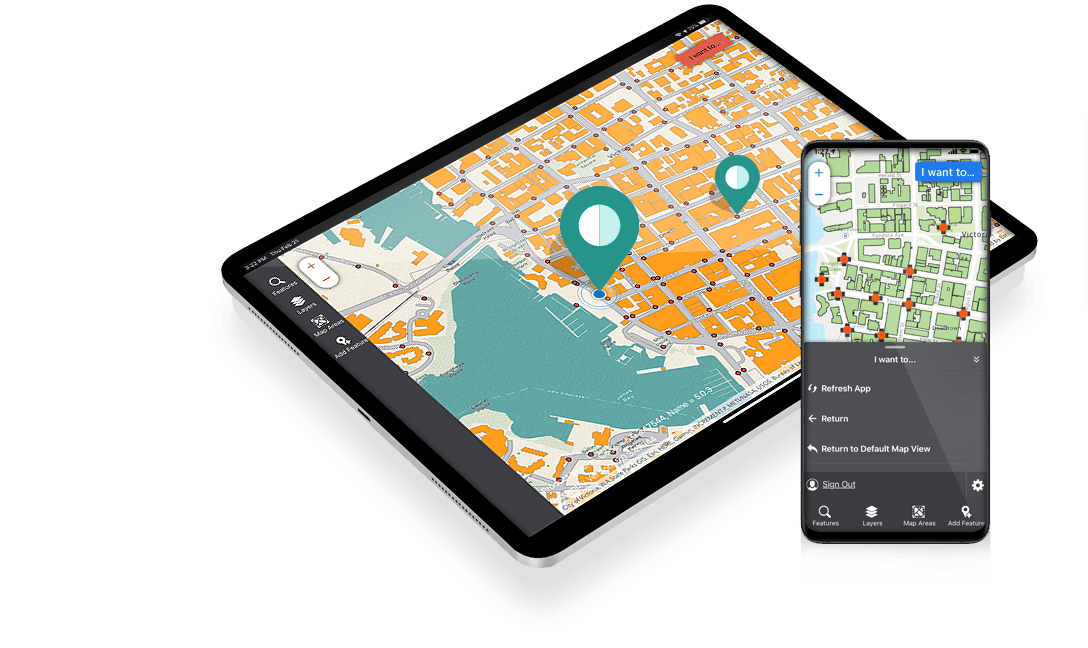
Site Mapping
Sub-meter accuracy + 3D terrain + AR overlay
Survey-grade precision for planning and development

Sub-meter GPS accuracy, Namibia datum (S...

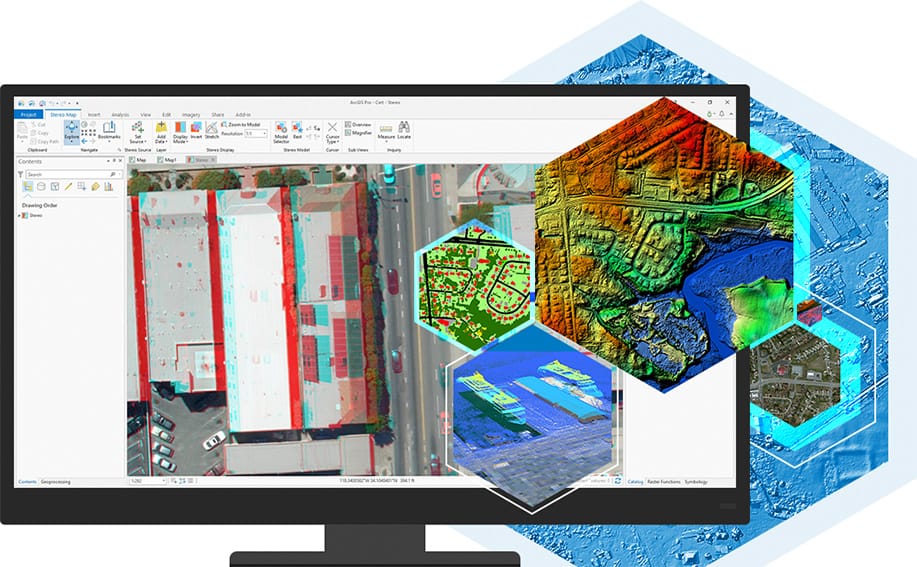
Total stations, drone photogrammetry, RT...
3D terrain rendering, contour styling, e...
Key Features:
Case Study:
Windhoek Infrastructure Planning: 15,000+ structures mapped with sub-meter accuracy, enabling water and electricity service delivery to 50,000+ residents.

Story Maps
Spatial storytelling + Multimedia + AR integration
Interactive narratives that bring geography to life

Location-based narratives, geographic st...

Mapbox Studio, Leaflet.js, AR triggers, ...

Visual storytelling, narrative design, e...
Key Features:

Case Study:
Namibia Tourism Story Map: 15,000+ AR interactions, 40% increase in time spent at partner sites, 25% boost in bookings.

Digital Mapping
Real-time location + Live data + API integration
Interactive web and mobile maps with real-time data

Real-time GPS, geofencing, spatial queri...

MapLibre GL, D3.js, WebGL, PostGIS, WebS...

Custom styling, interactive design, resp...
Key Features:
Case Study:
Health Ministry Dashboard: 85% faster insight generation, used by 50+ health officials for real-time disease outbreak tracking.

Print Cartography
Artistic design + AR enhanced + Exhibition quality
Beautiful, publication-quality maps for any purpose

Cartographic design principles, projecti...

Adobe Illustrator, large-format printing...

Artistic composition, typography, color ...
Key Features:
Case Study:
Ministry of Environment Annual Report: Award-winning design, 40% faster stakeholder comprehension, now used as template by 3 ministries.
Mapping Innovations
Pushing the boundaries of what maps can do

The Health Pattern Discovery
Our health facility maps revealed that 40% of disease outbreaks occurred within 5km of water points—a pattern invisible to standard maps that fundamentally changed Namibia's disease prevention strategy.

The AR Tourism Revolution
Our AR-enhanced visitor maps transformed static tourist guides into interactive experiences, increasing visitor engagement by 89% and driving 25% more bookings for partner lodges.

The Settlement Breakthrough
Using drone imagery and AI, we mapped 15,000+ structures in Windhoek's informal settlements—giving 50,000+ residents visibility in urban planning for the first time.
Industries We Map
Tailored mapping solutions for every sector

Urban Planning
Spatial
Tech
Creative
Public Health
Spatial
Tech
Creative
Tourism
Spatial
Tech
Creative
Conservation
Spatial
Tech
Creative
Disaster Management
Spatial
Tech
Creative
Education
Spatial
Tech
CreativeOur Mapping Process
From concept to creation—a proven methodology
Discovery & Design
1-2 weeks
Key activities:
- • Client vision workshop
- • Audience and use-case analysis
Creation & Refinement
2-6 weeks
Key activities:
- • Data collection and processing
- • Map design and layout
Delivery & Impact
1-2 weeks
Key activities:
- • Final map production
- • Print and digital delivery
Success Stories
Real results from real mapping projects

Ministry of Health
Kavango East Health Facility Atlas
127 facilities mapped in 3 weeks · 40% of outbreaks linked to water points (previously unknown) · 47% faster data collection
"The atlas didn't just show us where facilities are—it revealed patterns we never knew existed. Discovering that 40% of outbreaks occurred near water points fundamentally changed ou..."

Namibia Tourism Board
AR-Enhanced Visitor Maps
15,000+ AR interactions in first 3 months · 89% user engagement rate · 40% increase in time spent at partner sites
"These maps transformed how tourists experience Namibia. They spend more time at sites, learn deeper stories, and share their experiences on social media...."

Windhoek Municipality
Informal Settlement Mapping
15,000+ structures mapped · 90% faster than manual methods · 50,000+ residents now included in planning
"We went from no data to actionable plans in weeks, not years. For the first time, these communities are visible to city planning...."

Zambezi Regional Council
Flood Risk Atlas
72-hour advance warnings · 85% prediction accuracy · 40% reduction in property damage
"These maps save lives. Communities now know when to evacuate and where to go. The predictive modeling has been a game-changer...."
Technical Capabilities
The tools and expertise behind every map

Survey-Grade Equipment
- RTK GPS with sub-meter accuracy
- DJI Phantom 4 Pro drone
- Total stations for precise surveys
- Post-processing software

Software Mastery
- ArcGIS Pro / QGIS
- Mapbox Studio / MapLibre
- Adobe Creative Suite
- Blender 3D / D3.js

Spatial Expertise
- Namibia datum (Schwarzeck)
- ISO 19115 metadata
- Multiple projections
- Real-time data integration
The Business Case for Great Maps
How professional cartography drives impact, efficiency, and discovery

Reveal Hidden Patterns
- ✓Discover spatial relationships invisible to standard analysis
- ✓Identify optimization opportunities you didn't know existed

Enhance Communication
- ✓40% faster stakeholder comprehension with visual maps
- ✓89% user engagement with AR-enhanced maps

Improve Operations
- ✓47% faster field data collection
- ✓Optimized resource allocation with spatial insights

Drive Impact
- ✓N$50M in conservation funding secured
- ✓50,000+ residents now visible to planning
Our Cartographic Toolkit
Project Gallery

Health facility mapping project with AR integration

Interactive tourism map with multimedia storytelling

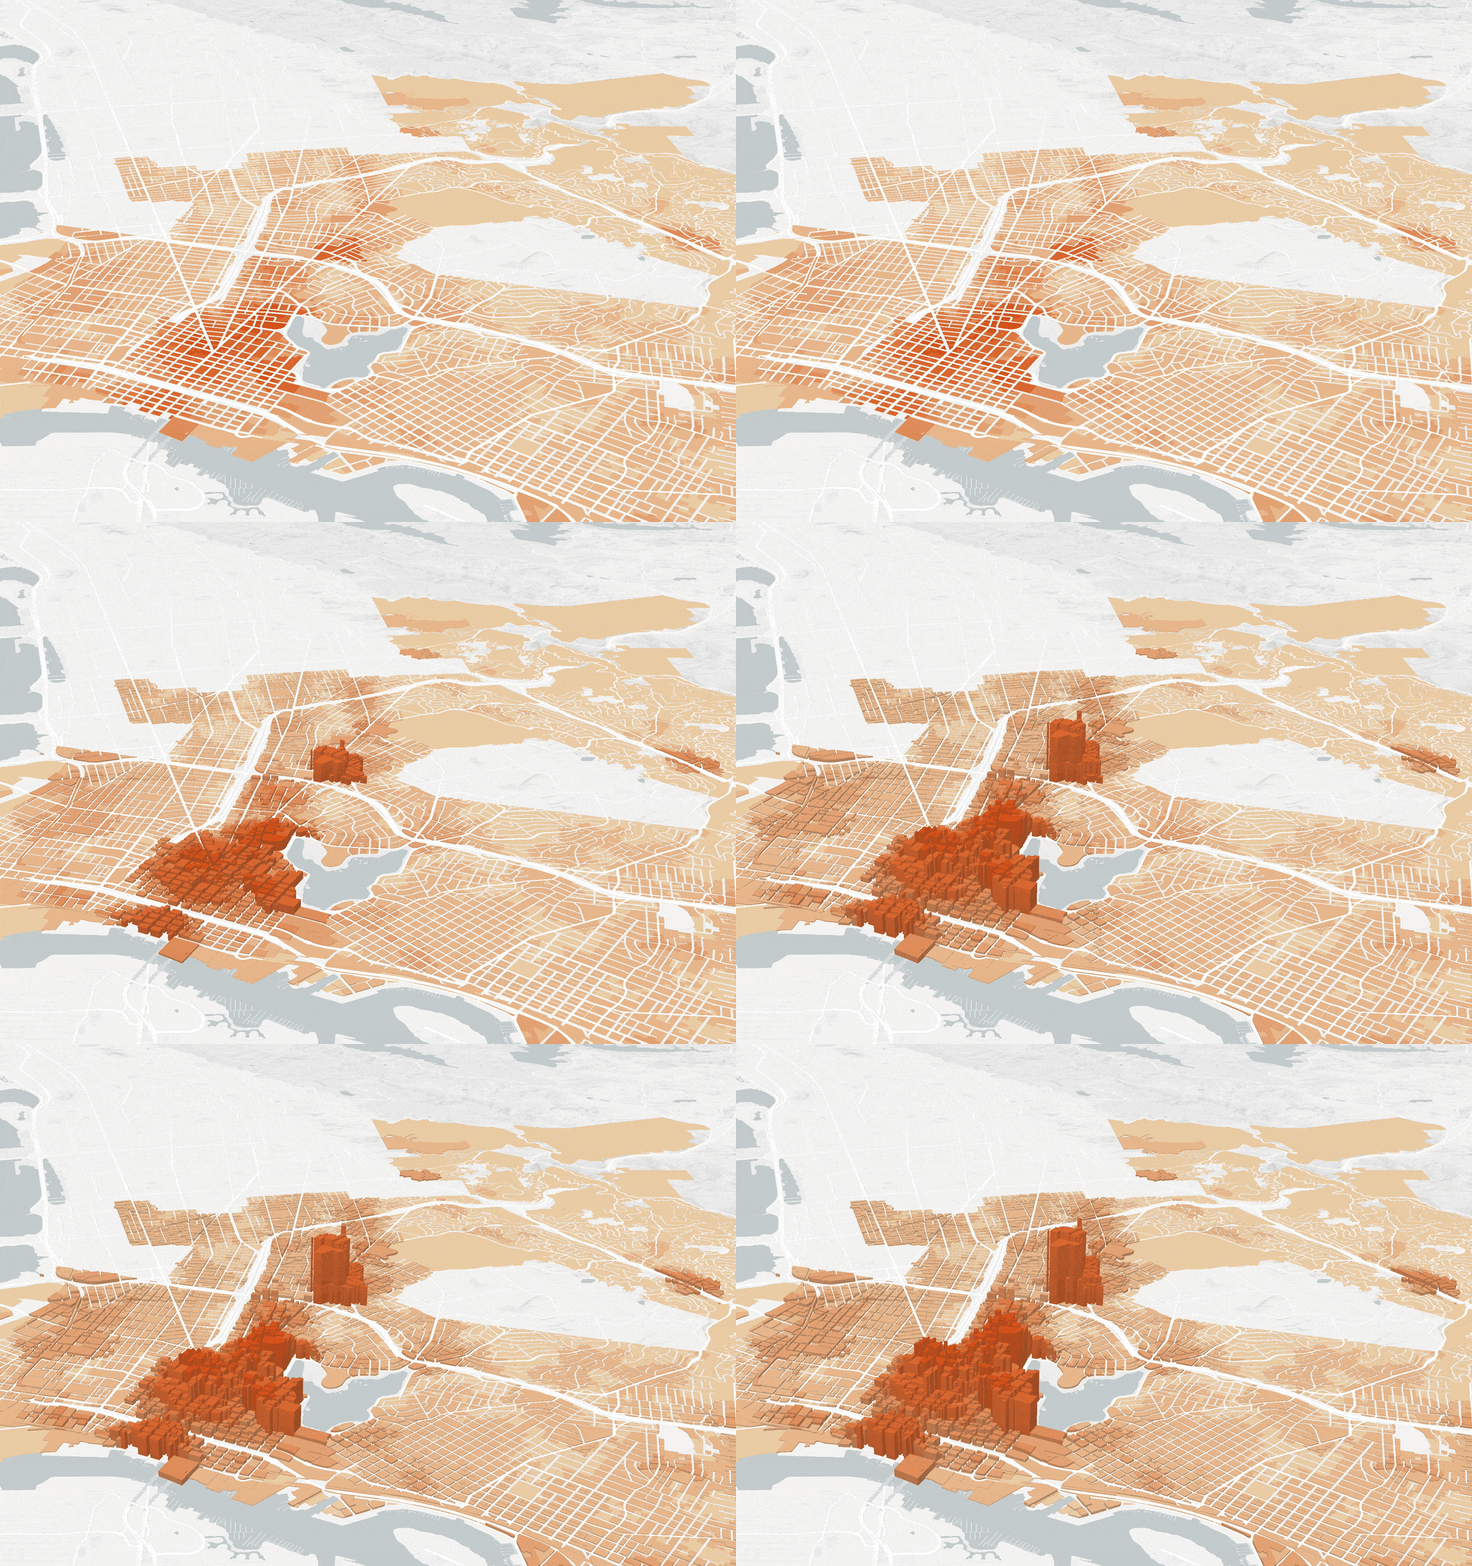
Urban planning map with 3D terrain visualization

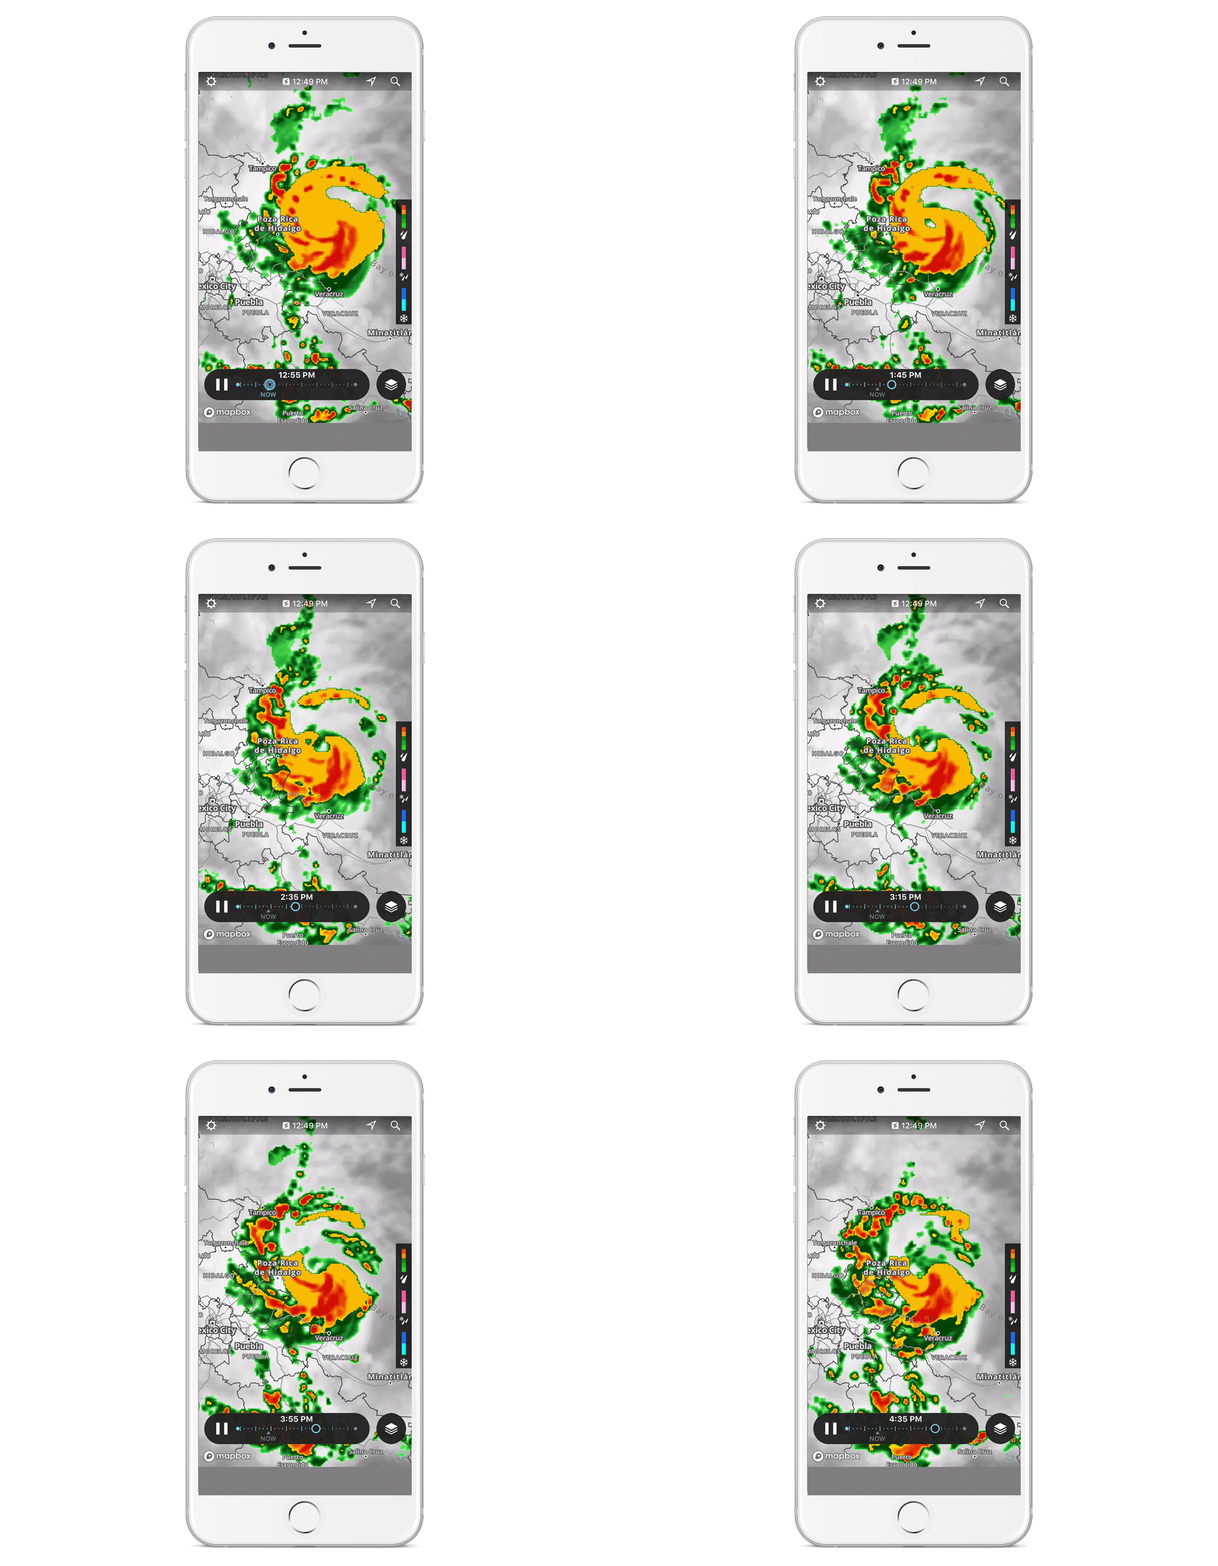
Disaster management mapping with predictive analytics

Ready to See What
You've Been Missing?
Whether you need survey-grade site maps, interactive story maps or AR-enhanced print, we create maps that reveal patterns, guide decisions and tell stories.

Spatial Storytelling

Sub-meter Accuracy

AR-Enhanced
✦ Free consultation ✦ Custom quotes ✦ Nationwide coverage ✦ 40% pattern discovery rate

Book a Free Consultation